Three AI principles every exec leader needs to understand
It’s no longer defensible for CEOs and boards to outsource understanding AI to their technology execs. I partnered with CxAI on a post about the three key principles that will enable execs to build that understanding. The post is below.
This week, we’re shifting gears.
Not to what AI can do for consumers and businesses, but to a more uncomfortable question: as an executive or board member, are you asking the right questions about AI?
Executives are approving budgets, signing vendor contracts, and sitting through AI strategy briefings. Yet in the UK, only 9% of businesses have actually adopted AI in any meaningful way (see our last post for details). And according to Deloitte, 66% of boards have little to no knowledge of the technology they are asked to fund.
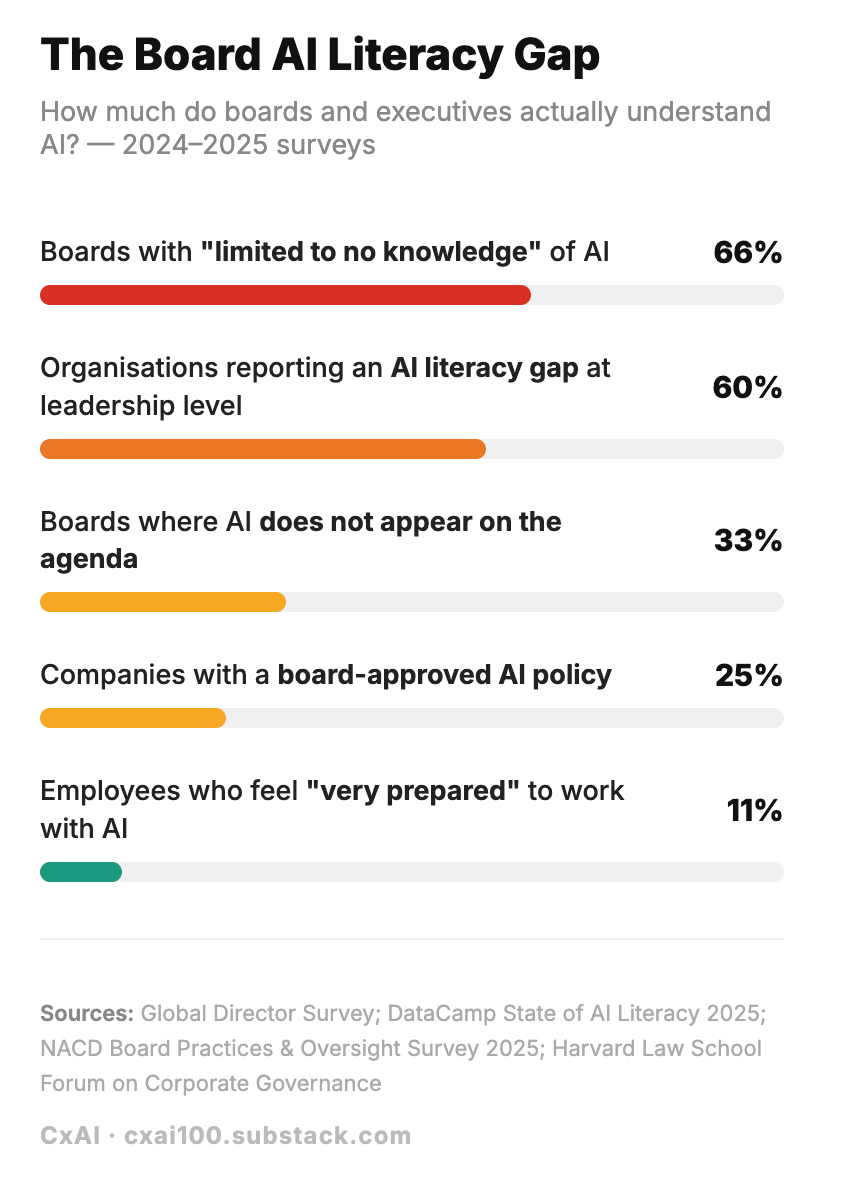
There’s a gap between sponsoring AI and understanding it and that gap can be expensive.
Before strategy, before tooling, before any budget is spent, there’s one skill that separates executives who lead AI initiatives from those who just fund them: knowing what to ask.
For this post, we partnered with Anna Shipman, a Chief Technology Officer with 20+ years delivering technology strategy, including at the Financial Times, the Government Digital Service, and most recently at Kooth, an AIM-listed Digital Health company. She writes about technology and leadership in her blog so subscribe if you find this interesting.
(Skip to the end if you want to see Anna’s top questions to ask)
What AI literacy actually means at the executive level
It doesn’t mean getting a computer science degree. It doesn’t mean taking classes or tracking every product launch. The pace of AI development makes that impossible, and that’s not your job.
What it does mean is understanding the principles that govern how this technology works, well enough to govern responsibly, challenge assumptions, and ask the questions your organisation can’t afford to skip.
Anna identifies three principles she considers non-negotiable for any executive making AI decisions today:
- AI is non-deterministic: you’re managing probabilities, not certainties
- The economics have flipped: it’s no longer about what you build, but what you buy and what that costs you long-term
- Competitive advantage is in integration: how you embed AI matters far more than which AI you use
1. AI is non-deterministic
The AI systems most companies are deploying today operate on statistical representations of language rather than grounded semantics. They don’t truly understand meaning or “know” things the way humans do. They are sophisticated, powerful pattern-matching engines, trained on historical data, that generate plausible outputs based on patterns they’ve seen before. Furthermore, those outputs will differ every time, even with identical inputs, because AI is non-deterministic.
The implications of this are significant:
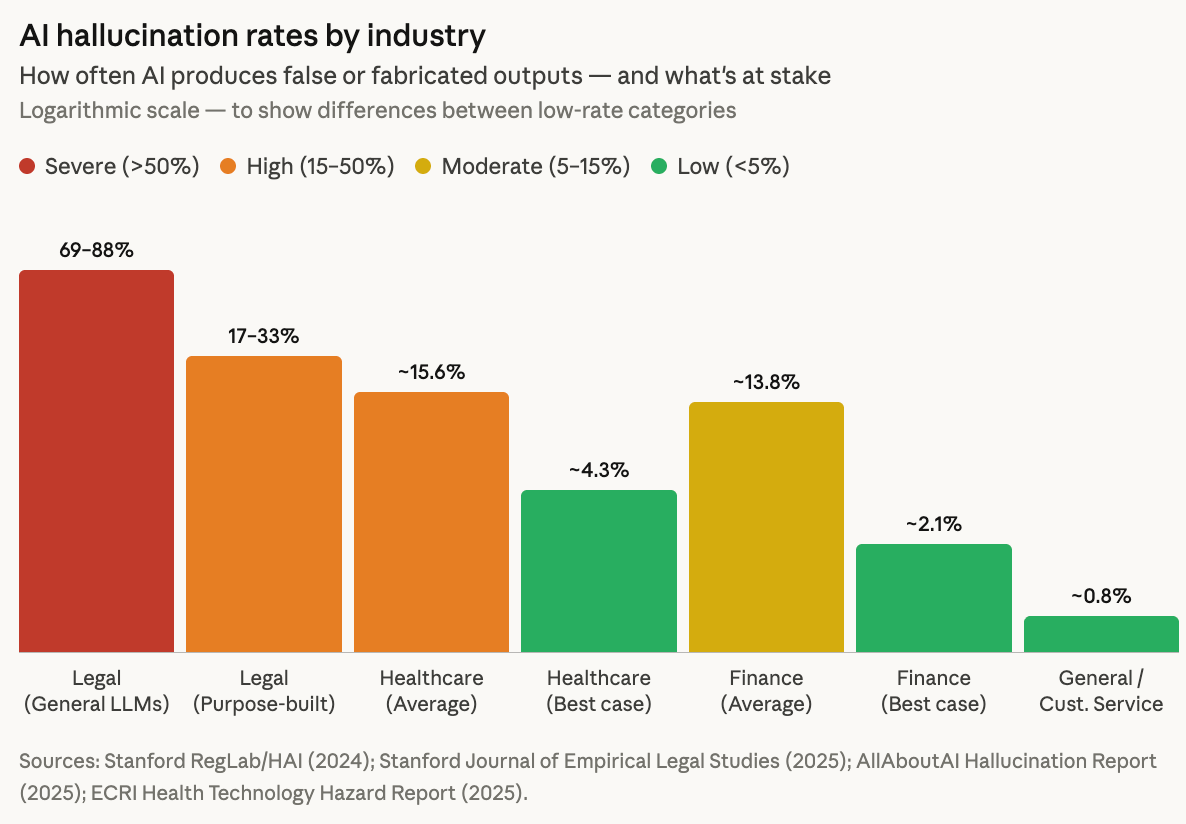
- They can’t distinguish between truth and convincing-sounding fiction. AI systems are prone to hallucination, confidently generating plausible-sounding but inaccurate or fabricated information. Hallucination rates vary significantly by industry and use case. It is possible to improve accuracy by employing checks and including more training data however these all come with significantly increased cost.
- Bias is coded into the system. Training data reflects historical patterns, including discriminatory ones. AI will reproduce and amplify these patterns with confidence.
- They don’t predict unprecedented situations. Models trained on historical fraud data, for example, will miss novel fraud techniques.
This is a feature of how the technology works, not a bug that will eventually be fixed. It is possible to improve accuracy with more training data, better fine-tuning and human review but these improvements come with significantly increased cost. You can’t eliminate AI errors entirely. You can only decide the level of uncertainty your business is prepared to tolerate.
Here’s the mindset shift that matters:
Traditional software is deterministic. If your input is X, your output will always be Y. Code quality, testing, and QA aim to eliminate bugs entirely. You release software when it’s “done.”
AI is probabilistic. If your input is X, your output will probably be Y, with a confidence level of Z. You release when the error rate is at a level your business can tolerate. A model that’s 95% accurate might transform your fraud detection, be catastrophic for medical diagnosis, or be perfectly acceptable for customer service FAQs, depending entirely on the cost of being wrong.
Risk tolerance is a strategic decision. Governance of that risk is essential and regulation is catching up as the EU AI Act and emerging frameworks require demonstrable oversight. Note also that Article 4 of the EU AI Act requires providers and deployers of AI systems to ensure a sufficient level of AI literacy among the people working with those systems on their behalf.
2. The economics have flipped
AI costs are now more like running a factory than buying software, continuous operational costs, not a fixed asset that depreciates.
Traditional software is typically modelled as high upfront build costs, low ongoing maintenance, with marginal costs approaching zero as you scale.
AI needs constant tending. While traditional software degrades gradually over time due to technical debt and advances in technology, the maintenance required for AI is far more active:
- Models drift. Performance erodes continuously without intervention. The world changes, but your model was trained on old data. Fraud patterns evolve. Customer preferences shift. Language changes.
- Data drifts. The data you feed the model in production starts looking different from training data.
- The underlying concept drifts. The relationship you’re modelling changes. A pandemic, for example, disrupted all retail forecasting models overnight.
AI models carry ongoing operational costs that scale with usage (compute and tokens), plus active maintenance, plus vendor dependency.
Given these costs, you might think building your own models makes sense. But foundation models have fundamentally changed the build-vs-buy debate. Prior to 2022, companies built proprietary models for competitive advantage. Now we have foundation models such as GPT-4, Claude Opus and Gemini, large-scale AI models trained on massive datasets that provide general-purpose capabilities out of the box. Training a frontier model now typically requires tens to hundreds of millions of dollars in compute, data, and specialised talent. GPT-4 alone is estimated to have cost over $100M to train; Gemini Ultra approached $200M. By contrast, adapting existing models through fine-tuning can cost from a few hundred to a few thousand dollars for many use cases, often reducing costs by 60–90%.
However, this creates a different problem, namely ongoing operational costs and strategic dependency on model vendors who control pricing. Once you’ve built critical operations around their models, switching becomes prohibitively expensive and vendors know it. The pricing you see today reflects the land-grab phase. This creates a different class of risk with ongoing operational cost exposure and structural dependency on model vendors. CloudZero’s 2025 State of AI Costs report highlights how organisations are rapidly increasing AI spend yet only around half can confidently measure ROI. Once core workflows are built around external models, switching costs kick in and businesses are exposed to cost volatility, opaque pricing models, and expanding usage-based spend. With spend in some cases rivalling traditional Engineering organisation expenditure, effective governance of AI operating costs is essential.
3. Competitive advantage is in integration
GPT-4, Claude, and Gemini are available to everyone. Most AI capabilities are “commoditising” rapidly, improving for all players at roughly the same pace. The technology itself isn’t your moat.
Yet for many organisations, the response looks something like this:
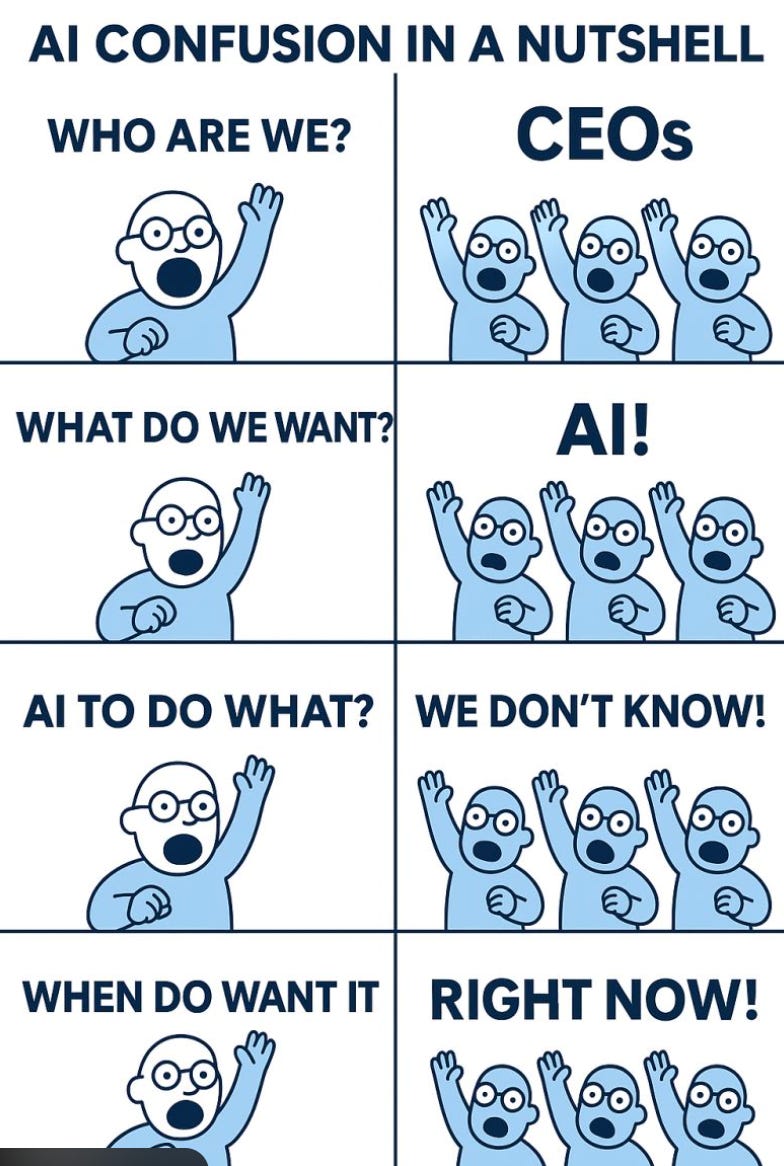
Competitive advantage will come from where AI is embedded in your organisation and how well you integrate it.
Data matters, but is unlikely to be your moat on its own. As we covered in a previous post on data strategy, clean, structured, accessible data is a prerequisite for AI to work at all. How intentionally you design your data integration will be a significant driver of competitive advantage. A compelling example is Walmart, who have invested in building a semantic layer over their own proprietary data creating a more defensible moat rather than simply plugging into ChatGPT.
Advantage sits at the application and organisational layer. Which workflows you redesign, which decisions you automate, how you integrate AI into day-to-day operations, how quickly you learn and iterate. This is where the real gains are made. The biggest wins often come from changing your operating model entirely.
Human-in-the-loop beats full automation for most use cases. AI can make individuals 30–50% more productive on certain tasks, but human-AI collaboration consistently outperforms either on their own. Humans can catch AI errors, while AI can scale human expertise combining forces to produce better results in what is termed diagnostic complementarity in this study. It’s worth noting that a decade on from Geoff Hinton’s infamous prediction that AI would eliminate radiologists entirely, there are more radiologists than ever.
We’ve heard from many CTOs that even where the speed of coding has been significantly accelerated, overall productivity hasn’t necessarily followed because coding was never the bottleneck. The organisations that will win are those who understand where their own velocity is actually constrained, and can align speed, governance, and learning accordingly.
Without intentional integration, AI will simply amplify the organisation you already have. It will not fix structural dysfunction.
Understanding AI is no longer optional
In the past, CEOs and board members could delegate understanding of these issues to their technology executives. This is no longer an option.
Fortunately, it’s now easier than ever to build this basic understanding with literacy by using AI itself to help you learn.
Start with these questions, that Anna has set out below, get real answers and you’ll govern AI investments with the same rigour you apply to everything else.
The questions to ask by principle
1. AI is non-deterministic: you’re managing probabilities, not certainties
Proposed investments What’s the acceptable error rate, and can this system deliver it? What’s our fallback when the AI is wrong? What does accuracy improvement cost – is the business case still viable?
Accuracy claims How is accuracy being measured, and does it align with business impact? (Overall accuracy can hide catastrophic failures in edge cases)
Deployment & operations What’s our process for monitoring accuracy over time? How often will we retrain the model, and who owns that? Do we have human review in place for high-stakes decisions?
Bias & fairness What’s in the training data – does it encode historical discrimination? If this system disadvantages a protected group, can we show we took steps to prevent that?
Accountability Who owns this system end-to-end — not just deployment, but when it fails? If regulators ask us to explain an AI decision, can we? What’s the incident response plan if this fails publicly?
Vendor relationships What visibility do we have into how third-party AI works and what biases it contains? What’s our recourse if their model produces discriminatory outputs under our brand?
2. AI costs are variable and unpredictable – your financial models need to adapt
Vendor dependency What happens if our AI vendor increases pricing 3x? Have we modelled that scenario? Are we locked into this vendor, or do we have realistic alternatives?
Model drift What’s our process for monitoring when model performance degrades? How often will we need to retrain or update models, and have we budgeted for that?
Strategic reality What happens to unit economics if usage grows 50x? In 2–3 years, could AI operational costs rival engineering headcount costs?
Workforce choices Have we made a deliberate choice — growth ambition or cost optimisation? Does the people strategy align with our business objectives?
Team capability What skills do we need more of, and what skills become less critical? Are we investing in training existing teams, or assuming AI replaces expertise?
3. AI doesn’t create competitive advantage, your data and execution speed do
Competitive positioning Given competitors have the same foundation models, where specifically does this create advantage for us?
Data as differentiator Is our data genuinely unique at scale, or table stakes everyone in our industry has? Have we invested in data infrastructure to actually use this data?
Organisational velocity Where is our organisation genuinely constrained by legacy systems vs. slowed by bureaucracy? What would it take to create a team that moves at startup speed while maintaining core systems?
Execution vs. technology How does our speed of iteration compare to competitors? Can we ship, learn, and improve faster?
This post originally appeared on CxAI.
Engineering Productivity in 2026: Where AI Actually Pays Off
Earlier this week I was on a panel with some excellent peers discussing AI and engineering productivity. We discussed how to measure engineering productivity; tactics for driving adoption; how this might change how we structure our teams and the impact on junior engineers, among other topics. Here are my notes.
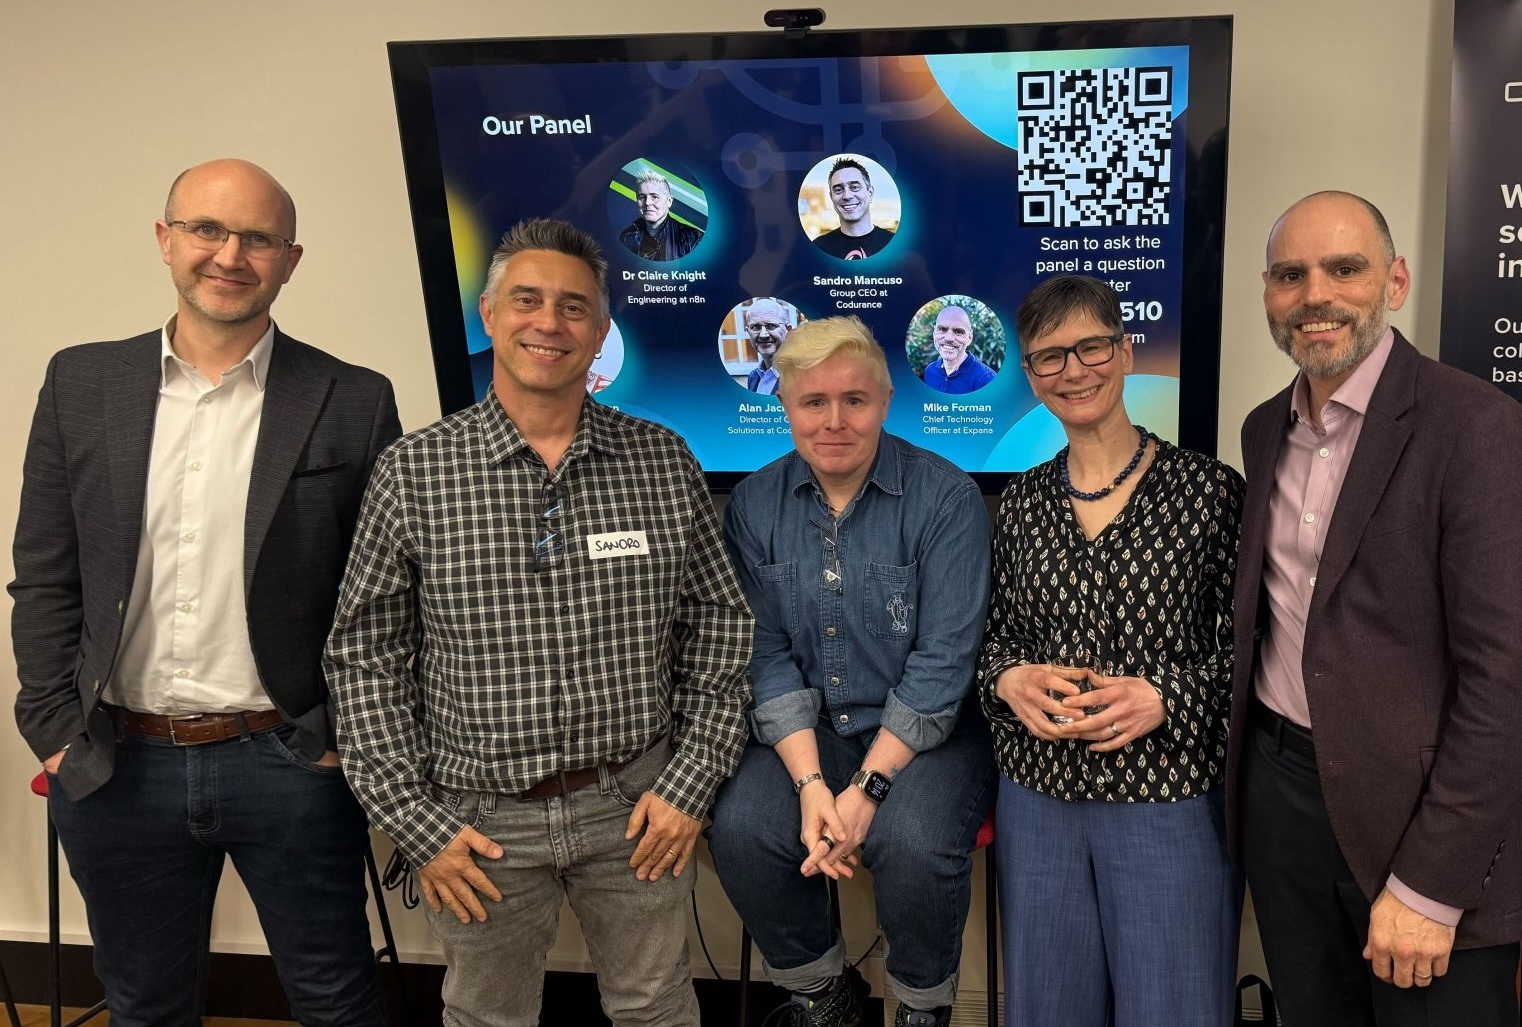 Photo (c) Matthew James
Some of the most interesting themes that we discussed were:
- AI amplifies, it doesn’t augment. Where there is strength it can really boost this, but where there is weakness it also amplifies this.
- This means strong software engineering skills, especially around technical architecture, are more important than ever. Agents are good at executing tasks but they do not have judgement about system design, and will follow the path of least resistance, so in a poorly structured codebase this will make things messier, at pace.
- One skill that will be ever more important is systems thinking. One audience member shared that he’d recently been to a talk about where the next generation of systems thinkers might come from and the answer proposed was gamers, where systems thinking is crucial to success.
- We’ve seen some brilliant productivity gains; for example, one of our panellists had challenged his team to find features that previously would have taken two weeks and deliver it in a day and they found a few. That doesn’t mean productivity has overall sped up 10x but shows where big step changes can be made.
- We also talked about this in light of other changes in our industry over the years and noted similarities, for example previous moves that have aimed to remove software engineers from the equation, like COBOL and CASE tools. In each case, the need for software engineering thinking and skills grew, even as the day-to-day work changed.
- This relates very much to our thoughts around juniors and even mid-level engineers. Software engineering as an industry has always had a lot of change, which is one of the things that makes it so interesting. People who are open to change and learning new skills will be able to develop, so encouraging that attitude and systems thinking is where our focus for the next generation of senior engineers needs to be.
- We talked about measuring productivity. This is far from a solved problem in engineering currently, and while many metrics have merit – we talked about DORA and Core 4 among others – there isn’t agreement. We did agree that lines of code has never been a good measure of productivity and it still isn’t now. I shared my view that measures of productivity will move further up the stack and be much more related to outcomes and what is actually delivered. We even floated the possibility that it could become closer to ARR.
- Interesting ideas were shared around how this might impact teams, including making them much smaller, maybe 2 engineers per team, and doing more with the same number of people. We also talked about how this can help with onboarding so potentially making it easier to flex the size of teams. One huge benefit of this work has been a renewed appreciation for documentation, as the AI agents need it. Finally!
Thank you to my fellow panellists Claire, Mike and Sandro, and Alan for facilitating the event. It was an extremely interesting discussion and I’m sure it’s not the last one we’ll be having on this topic!
The Engineer to Executive Translation Layer
Have you ever had the experience where you make a great proposal to your Engineering leader and it languishes for weeks and then comes back with a no for reasons that don’t seem to make sense?
Or your Engineering leader is keen, but they too report that it has gone into the higher levels of decision-making and not returned, or has come back with a no for unclear reasons?
As a CTO, I know that engineers on my team have had that experience; and as a member of the executive team I also know that there can be multiple challenges that get in the way of requests, suggestions or ideas from engineering.
Today I’d like to demystify this and give you some practical steps you can take to get your ideas across. I’ll cover three areas:
- How executives think — and how you should think about communicating with them.
- The translation layer — from engineering to executives.
- How to translate — for success and profit!
1. How executives think
With every piece of work you do, it is important to understand the user needs.
In the case of communicating with execs, what do they need from your communication? To answer this question, it is useful to understand the demands on your executive team, and what their motivations might be.
Your boss has a boss, and so does your boss’s boss
Starting at the top: the CEO runs the company, but they are still answerable to other people.
These stakeholders might include the board of directors, shareholders and customers. Depending on the domain and structure of the company, regulators and media/public opinion may also be primary stakeholders.
Understanding the drivers for your particular company is very useful.
Tip
If you have an opportunity to talk to your exec team, ask questions.
A question that shows curiosity about the business at a strategic level will not only give you useful and interesting answers, it will also show you in a good light as someone who is genuinely interested in these things.
For example “What would you say are the two or three forces or stakeholders that most shape our company’s direction right now?”
There are some factors that are golden and will be the case for all CEOs and exec teams. Any CEO is responsible for:
- Setting direction for the company
- Overseeing the allocation of resources (money, people and time) to what matters the most
- Hiring and leading the team
- Delivering results
- Safeguarding the enterprise (managing risks, reputation and compliance)
- Representing the company externally
Understanding the responsibility of the CEO sets the scene for understanding the motivations of the other exec, including your CTO.
As CTO, a key part of my role is working with my exec peers across the business to ensure the CEO is able to fulfil her responsibilities. In all but the tiniest of businesses, the CEO cannot do it all herself. That means, as CTO, my motivations are very similar.
So you should remember that any proposal you make needs to show how it can meet the needs of the exec, the CEO, or their stakeholders.
Execs are short on time because they have more areas to oversee
It is important to remember that almost all execs, likely including your CTO, are short on time to review your proposal.
By that, I don’t mean they are busier than you — you may be very busy, you may even feel overloaded — or that what they are busy with is more important than what you are busy with.
The difference is that the more senior in an organisation someone’s role is, the more their span of responsibility increases, meaning the more areas they need to oversee, meaning proportionally the time available to spend in each area is less. Mathematically, an Engineering Manager who manages a team of 6 will have more time to spend on your proposal than your CTO, who may have 250 engineers to oversee, or your CEO, who may have hundreds or thousands, or tens of thousands of employees.
So this point is not that execs are more busy than you, it’s that the number of things they need to be across is greater than yours and so the time they can spend on each is less.
For this reason, it is very important to make that time count.
Execs optimise for company-wide impact
As I mentioned above, the executives are supporting the CEO to run the company well, and a key part of that is working across the business to deliver, by thinking horizontally about the enterprise, not just within each discipline.
When you make a proposal, executives are weighing up how it might affect customers, other teams and financials across the company, not just how it might impact engineering.
It’s worth remembering that the CTO’s primary role is to work with exec peers across the business to deliver business outcomes, and that is the same for all of the exec team, and the CEO.
So any proposal you make has to make it clear that this is about the business, not about improving engineering for its own purposes.
Execs will have questions
Given the context above about the motivations of the CEO and the execs, you can anticipate some of the things they will want to know.
Here are some key questions that all execs are likely to have.
- How much will it cost?
- What will I get for the money?
- What other options have you considered?
- Why now, and what happens if we don’t do it?
- How will success be measured, and on what timeline?
- What are the key risks, and how do we mitigate them? How might this fail?
- Who owns delivery, and how confident are we in execution? Can we phase or pilot this to reduce risk?
- How might this affect other areas of the business? Have you engaged with those stakeholders?
If you can anticipate these questions and include them in your information this will save time back and forth.
Some questions you may get asked may seem nit-picky or too in the details. If you are used to autonomy they may feel like micromanagement. But it’s worth reflecting that it is the job of the CEO to oversee the allocation of resources and ensure the right trade-offs are being made, and it is the responsibility of any exec to ensure they understand what they are agreeing to. That is the purpose of the questions they ask.
Over time you will learn to anticipate questions and include the relevant details without being asked. The more you can address questions and concerns upfront, the quicker you will get to an answer.
The Engineer to Executive Translation Layer
The above thoughts apply to any discipline that wants to communicate with the exec, but there are some details about engineering that mean the gap can be harder to bridge.
In this section I’ll explain some of that context and then talk about where the translation layer comes in.
Execs and engineers speak different languages
Engineering is a broad and deep field and there are a lot of specialisms within it.
Even as an engineer, you can’t have the full context of every area; and it’s quite likely that you don’t even have the full technical understanding of everything your team does that you don’t work directly on.
The language we use to communicate within engineering, even without taking into account specialisms, doesn’t translate well outside of that context. Think about API, CI/CD, regression, latency, blue-green deployment. These are examples that most engineers would understand and have context about, whereas someone outside of engineering is much less likely to understand, and may even apply a different meaning to some of these words.
You need to make sure you use language tied to business outcomes.
Executives’ goals are on a long time horizon
When we think about work in engineering, the goals and time horizons are different.
We might talk about delivering specific features; upgrading our development framework or improving test coverage, activities that might take days or weeks. If looking at a longer time horizon, we might talk about a technical re-architecture, improving reliability and uptime, or improving the performance of database access; these can take months and sometimes more than a year.
However, exec goals might be things like increasing EBITDA, reducing CAC, strengthening brand reputation, or improving employee engagement and retention. The language is very different, and the minimum time horizon is likely to be a year, or multiple years.
Your goals in engineering should always map up to these wider organisational goals, but when talking about them day to day, the language is very different. It’s likely that the exec team will translate the exec goals into language that makes sense to each of their disciplines and your CTO probably does this for you.
Here, we are talking about using the translation layer in the other direction – for your work to make sense.
Engineering is expensive
Remember that engineering may be one of the largest investments your company makes.
Engineering salaries are often higher than other roles and this is especially the case if you work in a company that is not a tech company. This means that execs will want to understand tech investments even more closely and so why it’s even more important that they do.
Hence the need for a translation layer
The way I like to think about this is like a translation layer, a component that converts data from one set of formats to another to allow different systems to communicate with each other.
![]()
Consider the translation layer when talking to your CTO
Many CTOs, like me, have a strong engineering background, and so I will understand some of the requests you make without needing further explanation. For example if you suggest that we try to release more frequently, or automate more of our deployment pipeline, I’ll understand why these matter without needing justification.
However, some proposals won’t be so clear cut and I may need more evidence that you’ve thought through the potential implications and that this does have a clear business benefit.
Whether it’s very straightforward or needs a bit more explanation, your CTO is likely to be busy. You might not need to fully use the translation layer, but the more you can be brief, link it to outcomes and address questions they may have upfront, the better.
If your request is via your CTO, they are the translation layer
Some proposals will need buy-in beyond your CTO.
For example, requesting something that is outside the existing budget, or something that will impact other teams directly. If you don’t do the translation work, you are expecting your CTO to do it. You make my job much easier by understanding what I need in order to be able to support those conversations.
For example, if your proposal includes a request for money that is not in the current budget, your CTO will likely need to speak to exec peers, or the CEO and/or CFO to determine whether additional funds can be found. If you have given the CTO a proposal that will not make sense to these stakeholders or answer the questions they are likely to have, then you have given the CTO extra work to do.
The single most helpful thing you can do is be the translation layer yourself.
If you are speaking directly to other execs, you need the translation layer
You might be speaking directly to other execs.
If you don’t translate, they will have to do a lot of extra work to understand what you are asking for. Even when your CEO or the exec you are talking to was formerly an engineer, don’t forget they have a huge amount of other context and not much bandwidth for your request, so even if they have the experience to understand it, it might not be available in that moment. And most execs won’t have that background.
If you don’t do the work of translation, the best case is you slow down the decision while they do the translation, often by asking you a lot of questions. But much more likely is that your proposal is rejected, or just never returns.
You should be the translation layer
You may be wondering why it is on you to do this work.
After all, it’s very likely that your proposal is something that will benefit the CTO or the exec — they may have even asked you to do this work — and you also have a day job. If the proposal you are making will benefit the company, why does it fall to you to be the translation layer?
My philosophy on this is simple. Think about the outcome you want to get to. Think about the user needs and do the hard work yourself to make it easy for your user.
Being able to be the translation layer yourself will benefit you and your teams wherever you go. Communication is the hardest thing to master and yet the success of all our enterprises depends on it. This is a skill set that will take you far.
3. How to translate for success and profit!
So far I’ve talked about the motivations and demands on the exec — what the user needs, what the translation layer is, and when you should use it.
In this section I will give you some concrete instructions that will help you be your own translation layer.
“Bring me solutions, not problems!”
It’s a cliche that execs want solutions not problems, but like many cliches there is truth in it.
As an exec, I would much rather know about problems than never find out because you didn’t want to tell me without a solution, so please don’t let this become a reason not to flag areas where your leaders should be concerned.
However, you do not want to pass all decisions up to your boss to make.
You yourself have great ideas about how to solve issues you see, and generating good solutions is a skill that definitely improves with practice. If you want your proposal to land, it needs to cover not just “we should solve this problem” but “and here’s one way we could do that”. It’s also useful to include some other options that you considered and discarded.
Your initial proposed solutions may not align with business value, but you will get feedback and learn and improve. If you never try, you will never get better and you will find you are senior and still making similar suggestions that do not get adopted.
Never forget the “so what”
Don’t leave the person you are communicating with to work out for themselves why something is an issue.
A statement like “our build times have doubled” leaves the listener hanging. They have to guess whether that’s a cost issue, a morale issue, a delivery risk, or even a positive outcome. Instead, connect it to impact:
The “so what” translates a fact into something with meaning.
Never forget that the person you are communicating with does not have all the context you have, so make it easy for them to understand why your point is something that matters.
Make it brief — one page, 5 slides, 5 minutes
I talked above about why execs have less time for looking at the proposal. You should therefore make it as brief as you can. If it takes too long to read a proposal then it will be delayed until the reader can find sufficient time to go through it.
My favourite form of receiving and delivering written communication is a one-page document — a “one-pager”. Others have other preferences; a common preference for execs is a slide deck. Whatever the convention is in your workplace, it is very important that you make it brief.
The advantage of being brief is that you have to try really hard to make sure you distill the key information. You are asking someone to make a decision and you can’t expect them to identify the most salient details if the doc flows over 10 pages, or the explanation takes 20 minutes.
If it’s a presentation, consider how you can limit it to the shortest number of slides. If it’s a conversation, be prepared for it to last 5 minutes – even if you have 30 minutes scheduled, no executive will mind you getting to the point more quickly than anticipated!
Whatever the format, always ask yourself, for every piece of content you want to include: is this crucial for the reader to know in order to make an informed decision? The less content you have, the easier it is to get to a decision.
Get to the point — bottom line up front
Whatever format you use, you should always include an executive summary and make sure it includes the most important information: what action you are looking for.
“Bottom line up front” means lead out with this.
An executive summary tells the reader in a few short sentences what this document is going to cover. If this is a presentation rather than a document, include an executive summary slide. If this is a conversation, set it up right by explaining first what the purpose of the conversation is.
If you are asking for a decision, make sure you’ve included what the decision is. My approach is to include an executive summary in every document, whether it’s for an exec or not. Remember, execs are smart people, short on time, who do not have all the context you have; this exec summary tells them why this communication is worth their time, and what action you are hoping for following it.
Examples
Here are some example exec summaries. For a document:
- This proposal recommends consolidating our infrastructure onto a single cloud provider to reduce operating costs by 20% over three years, improve reliability, and accelerate feature delivery. The alternative is to retain our split between AWS and Azure. The work will reduce capacity of the platform team by 50% for six months, delaying completion of the work on pipelines until Q4 2026.
- We request an additional budget of £50k for the engineering team to have access to an AI coding assistance tool. We have demonstrated in our trial that use of Cursor increases throughput of work by 25% meaning over a year we would deliver extra features equivalent to the salary of four additional engineers, therefore this would pay for itself by end Q1 next year.
In a conversation you might say:
- “I want to propose we start upgrading our data handling now rather than in Q3 as planned because our latest planning session raised a flag that we may not hit the deadline. We’d have to pause the work on the new dashboards to do that.”
- “There’s a strong business case for investing more in developer experience in next year’s budget. I can show you the ROI calculation we’ve done, but I would like your take before we move forward with the budget preparation.”
Be rigorous!
Include measurement, particularly how you will measure the impact of what you are suggesting. Do spend time on this and be rigorous about it, and use the guidance above to think about what metrics or measures the execs will care about.
For example, you might propose adopting a new chat or project management platform because the interface is much improved and it’s easier to track tasks. But this will not convince an exec. In this case I would want to see data showing that it actually reduces meeting time, speeds up delivery, or improves cross-team collaboration.
And don’t forget the “so what”! Spell it out: “In our trial, cross-team bug resolution time fell 40%” So what? “…reducing production risk and improving customer satisfaction.”
A big advantage of including measurement is that then it’s easy to show progress or learning.
We said that this would reduce the time it takes to review PRs by X%, or we said this would have this financial impact, and it has, or it hasn’t.
It can be very hard to work out the measures, but the investment is very much worth it, as it strengthens both your business case and your recognition of the impact.
Don’t use jargon
The last and in some ways easiest part of the translation layer is the literal translation of jargon.
Assume you are communicating with a smart and motivated person who doesn’t have to hand the details that you do about your work. Many things that are self-evident to you as an engineer will not be to your audience.
The more you use jargon, or rely on concepts that require a particular engineering background, the harder it will be to make your case. Don’t patronise your reader, but explain things clearly: do the hard work to make it simple. Don’t forget to tie it to what you know they care about. You don’t need to explain every detail, just the salient features.
For example:
- You don’t need to say “we encrypt all sensitive data at rest and in transit” — you can say “we ensure sensitive data is fully protected”.
- You don’t need to say “we implemented circuit breakers and retries in our microservices” — you can say “we made the system more resilient”, or even “we did some work that reduced outages”.
A personal bugbear of mine is the phrase “tech debt”.
It doesn’t share context well within engineering as it can mean different things to different engineers (for example, the natural result of entropy vs an explicit decision we made to cut a corner) so it obscures what the actual issue is, and even more so to an outside observer such as an exec.
Sarah Wells explains really clearly here why “tech debt” doesn’t land and how to make the case for this work.
The translation layer may kill your piece of work
I want to finish on one note to bear in mind.
It is possible that after passing your proposal through the translation layer you realise it is not actually going to make the grade. You’ve done the above work and you cannot align your objectives with organisational objectives in a way that will make sense to execs.
This can be a hard lesson, and in my career I’ve certainly had some disappointing rejections of work that I genuinely believed was important and valuable and that I was unable to gain buy-in on even when my exec team fully understood it.
This, however, is an extremely valuable learning.
Not everything that seems like a good thing to do is actually something that would be valuable in your business context at this time. It does not mean it would never be a good thing to do (though it may mean that!) but it does mean that now isn’t the time.
By passing it through the translation layer yourself, you can get to that understanding without spending other people’s time — and you will still get the learning. And your next proposal will be much stronger.
Bottom line
Everything comes down to user needs. Your goal is to communicate in a way that makes it easy for the receiver to understand how what you are saying meets those needs.
Clearly tie your proposal to results the person you are communicating with will care about, and make it easy for them to understand how it achieves those results.
So here are the main takeaways:
- Optimise for executive priorities — execs think horizontally across the business, optimising for company-wide impact, so tie your proposals to broad business outcomes. Show how you’ll measure impact, always include the “so what,” and explain technical concepts clearly.
- Bottom line up front — executives have broader spans of responsibility, meaning less time per area. Lead with a short executive summary stating what decision you need and why. Only include what’s crucial for decision-making, and anticipate the questions they’ll ask: cost, ROI, alternatives, timing, risks, and how you’ll measure success.
- Be your own translation layer — don’t expect your CTO or other execs to translate technical details into business language. Do that work yourself by connecting engineering work to the business outcomes they care about.
I wish you the best of luck in your future communications!
This post originally appeared as a guest post on Luca Rossi’s newsletter, Refactoring.
Never split the difference
Never split the difference is a very interesting book. The pitch is a book on negotation by a former FBI hostage negotiator, but I found it to be a useful and practical guide to communication in general. Here are my notes.
Negotiation is communication with results
The author, Chris Voss, spent many years as an FBI hostage negotiator and his contention is “life is negotiation”. He points out various ways that you negotiate in daily life. Not just negotiating a raise or a child’s bedtime but also for your idea to be heard in a meeting or to understand how to perform well at your job.
He says “negotiation is the heart of collaboration”.
‘Never split the difference’ is about getting everything you need
The author explains this by talking about hostage negotiation. If they have four hostages, you would never say, ‘OK, let’s split the difference, give up two hostages and we’ll call it a day’.
A note on tone Almost every default person is male in this book which makes for a slightly irritating read. He also dramatises true events, some of which have tragic outcomes. So bear in mind, the tone of this book may not work for you.
Negotiation is not battle, it’s discovery
The goal is to uncover as much information as possible.
He says a good negotiator is prepared for there to be surprises, but a great negotiator uses their skills to uncover the surprises they know are there.
Don’t commit to assumptions – instead use them as hypotheses to test, and use the negotiation to do so.
The first stage is active listening
People want to be accepted and understood. When listened to, people listen to themselves more and clarify their own feelings.
Focus solely on what they are saying.
He talks about some familiar techniques. For example, mirroring: repeating the last three words someone said, in a calm voice, as a question.
He also talks about starting with “I’m sorry…?” with the intent to be curious, learn more. They will rephrase. If you say “What did you mean by that?” people will get defensive but “I’m sorry…” and mirroring gives clarity, while signalling respect and concern for what they are saying.
He also advises that your voice is important. He talks about the “late night, FM DJ voice”, deep, slow, reassuring. And your standard voice should be positive/playful. Relax and smile.
For example, they say “I need two hard copies of every document.” You say, positively, and with curiosity, “I’m sorry, two copies?”
Slow… it… down. Going too fast can make people feel they are not heard.
Labelling an emotion lets it move from raw feeling to rational
Say “it sounds like…”, “it looks like…”, “it seems like…”, not “I am hearing…”. Don’t make it about you. Then be quiet and listen, don’t say more.
Labelling an emotion in a neutral statement of understanding encourages your counterpart to be responsive.
Labels help uncover the primary emotion driving all of your counterpart’s behaviour. It might be the first label or the second, you may have to dig deeper, but by digging, you find the emotion that – once acknowledged – seems to miraculously solve everything else.
Label the barriers to agreement
This is the part of the book I found most counterintuitive, yet actually works.
Prior to seeking agreement, do an accusation audit. What are all the things they might say about you as a reason to not agree to your proposal? Then you lead out with them. “You may feel…”
If they are unacknowledged or denied they have power. But if you label them, calmly, it takes the sting out of them, and helps your counterpart hear that you are understanding their viewpoint and are prepared to work with them.
He gives some good examples of this working in the book, and I have used this with success since I read it.
He calls this tactical empathy
Acknowledging how your counterpart feels immediately conveys that you are listening, and once they know you are listening, they may give you useful information. Tactical empathy is hearing what is behind that.
He says “It may sound touchy-feely, but if you can perceive the emotions of others, you have a chance to turn them to your advantage.” Hah! That doesn’t sound touchy-feely at all, it sounds mercenary! But useful.
Getting to … no
His contention is that a “no” is actually when you get the negotiation started.
There are three kinds of yes: counterfeit (to get you to go away or disingenuously to learn more), confirmation (that’s correct, reflexive) and commitment: the one you want.
However, he says actually you want to start with no, which can mean many things and frees people up to enter the negotiation. Preserving your counterpart’s autonomy by giving them permission to say no, calms them, allows them to feel they are in the driving seat; they’ve protected themselves; and that frees them up to listen to other views.
You could say “Is now a bad time to talk?” instead of a good time, so you get a no early! You could force a no by saying something totally wrong. Or talk about what they don’t want.
He says if your biggest fear is no then you are a hostage of “yes”; you can’t negotiate.
He also says that if you can’t get them to say no to anything then they are not ready to negotiate. They are indecisive, or confused, or hiding something, and you need to walk away.
“That’s right”, not “you’re right”
“You’re right” doesn’t indicate commitment to take action, or even agreement. “You’re right” is what people say when they agree in theory but don’t own the conclusion. Summarise their position, really understand their point of view, play it back to them and get a “that’s right”.
He also says humans have an urge towards socially constructive behaviour. The more a person feels understood and positively affirmed, the more likely that urge for constructive behaviour will take hold.
People need to feel they are equally or even solely responsible for creating the connection and the new ideas they have. One way to do this is to have them feel they are defining success. “How will we know we are on track?” and “How will we address things if we find we’re off track?” And then summarising their answers until you’ve got a “that’s right”. Then you know they have bought in.
Bending reality
You need to show the other party they have something concrete to lose if the deal falls through. For example, you could let them know you are offering it to them, before someone else. People will take more risks to avoid a loss than to realise a gain.
Another way to bend reality is to offer a range, and the number you want is in the low end. For example, you are looking for a salary of £90k, so you say (truthfully, don’t make it up) “At top places like $COMPANY, people in this role get between £110 and £130k”.
Here, he describes negotiation as “the art of letting someone else have your way”.
The F-bomb: fair
Another way to bend reality is by bringing in discussions of fairness. He describes “fair” as a tremendously powerful word for good or ill; the “F-bomb”, most commonly used as a “judo-like defensive move that destabilises the other side” and suggest some tactics to counter it.
If someone says they’ve made a fair offer, you can say: “Fair? Seems like you’re ready to provide evidence that supports that?”
Or if someone says you’re not being fair: “I apologise, let’s go back to where I started treating you unfairly and fix that”.
The positive and constructive use of fair is early in an negotiation: “I want you to feel you are being treated fairly at all times so stop me at any time if something seems unfair and we’ll fix it”. This sets you up as an honest dealer. You are then letting people know it’s OK to use the F-bomb if they use it honestly.
Calibrated, open-ended questions – not “why”
When it seems there isn’t a way forward, you can ask for your counterpart’s help in solving the problem. How do I x? This gets them to solve the problem, feel in control, and even feel like it was their idea.
So instead of “I can’t do that”, say “how am I supposed to do that?”. Instead of “don’t leave” say “what do you hope to gain by leaving?” Tone of voice here is very important; respectful.
Calibrated questions are open questions (i.e. can’t be answered with a yes or a no), and start with “what” or “how”. He strongly advises not starting with why, which gets people defensive. Only use why if you want them to defend a goal that serves you.
“Why did you do that?” can be recalibrated as “What caused you to do that?”.
The aim is to get them to think, not to just give a fact or defend a position. The implication of a calibrated question is that you want what she wants, but you need her intelligence to help you get it.
Tone is critical – not an accusation, a request for assistance.
Carefully calibrated questions convince them the final solution is their idea. And people work harder implementing their own ideas.
Examples of calibrated questions
- What is the biggest challenge you face?
- What about this is important to you?
- How can I help to make this better for us?
- How would you like me to proceed?
- What is it that brought us into this situation?
- How can we solve this problem?
- What’s the objective?
- What are we trying to accomplish here?
One relevant to job interviews is “what does it take to be successful here?”. This can also gain you someone vested in your success.
Instead of “does this look like something you would like?” you say “how does this look to you?” or “what about this works for you?” or “what about this doesn’t work for you?”.
Pause and try to get more information
Remain calm. If you start to feel angry, or you are attacked in a negotiation, pause and ask your counterpart a calibrated question.
Informal moments reveal information. It’s great to get face time because you can learn much more. He has a lot of examples of how to look for additional information, for example, the moment their requests don’t make sense is a time to push for more information.
He finishes with a plea for honest and clear conflict
When talking about getting to ‘no’ he calls this the “anti-niceness ruse”, not in the sense that this is unkind but in the sense that it’s authentic, not falsely polite; peeling away the “plastic falsehood” of yes and getting to what’s really at stake.
At the end of the book he reflects that one can only be a good negotiator by listening empathetically and speaking clearly, by treating everyone with respect and by being honest about what you can and cannot do.
The adversary is the situation, and the person you appear to be in conflict with is actually your partner.
This book was not what I expected
I had expected a book on straight negotiation tactics, but what I got from this was more about communication in general. I have found the techniques really useful in helping to open up conversations, so that everyone can think about solutions to their best ability.
I found his argument that this is about authentic communication and constructive conflict very compelling.
There are a lot more practical tips in the book, specifically around negotiation, that I haven’t noted here and you may well get something different from it: I definitely recommend reading it.
You can also read my notes on some other books.